Ops Hub — Case Study
AI-Powered Operations · Built in Lovable

The
Ops Hub

A custom internal operations dashboard built from scratch. It integrates financial tracking, headcount planning, OKR visibility, and investor reporting into a single source of truth.
Company Syntracts
Role Chief of Staff
Built With Lovable · QuickBooks · Copper CRM
Timeline Built in days · Rolled out within 60
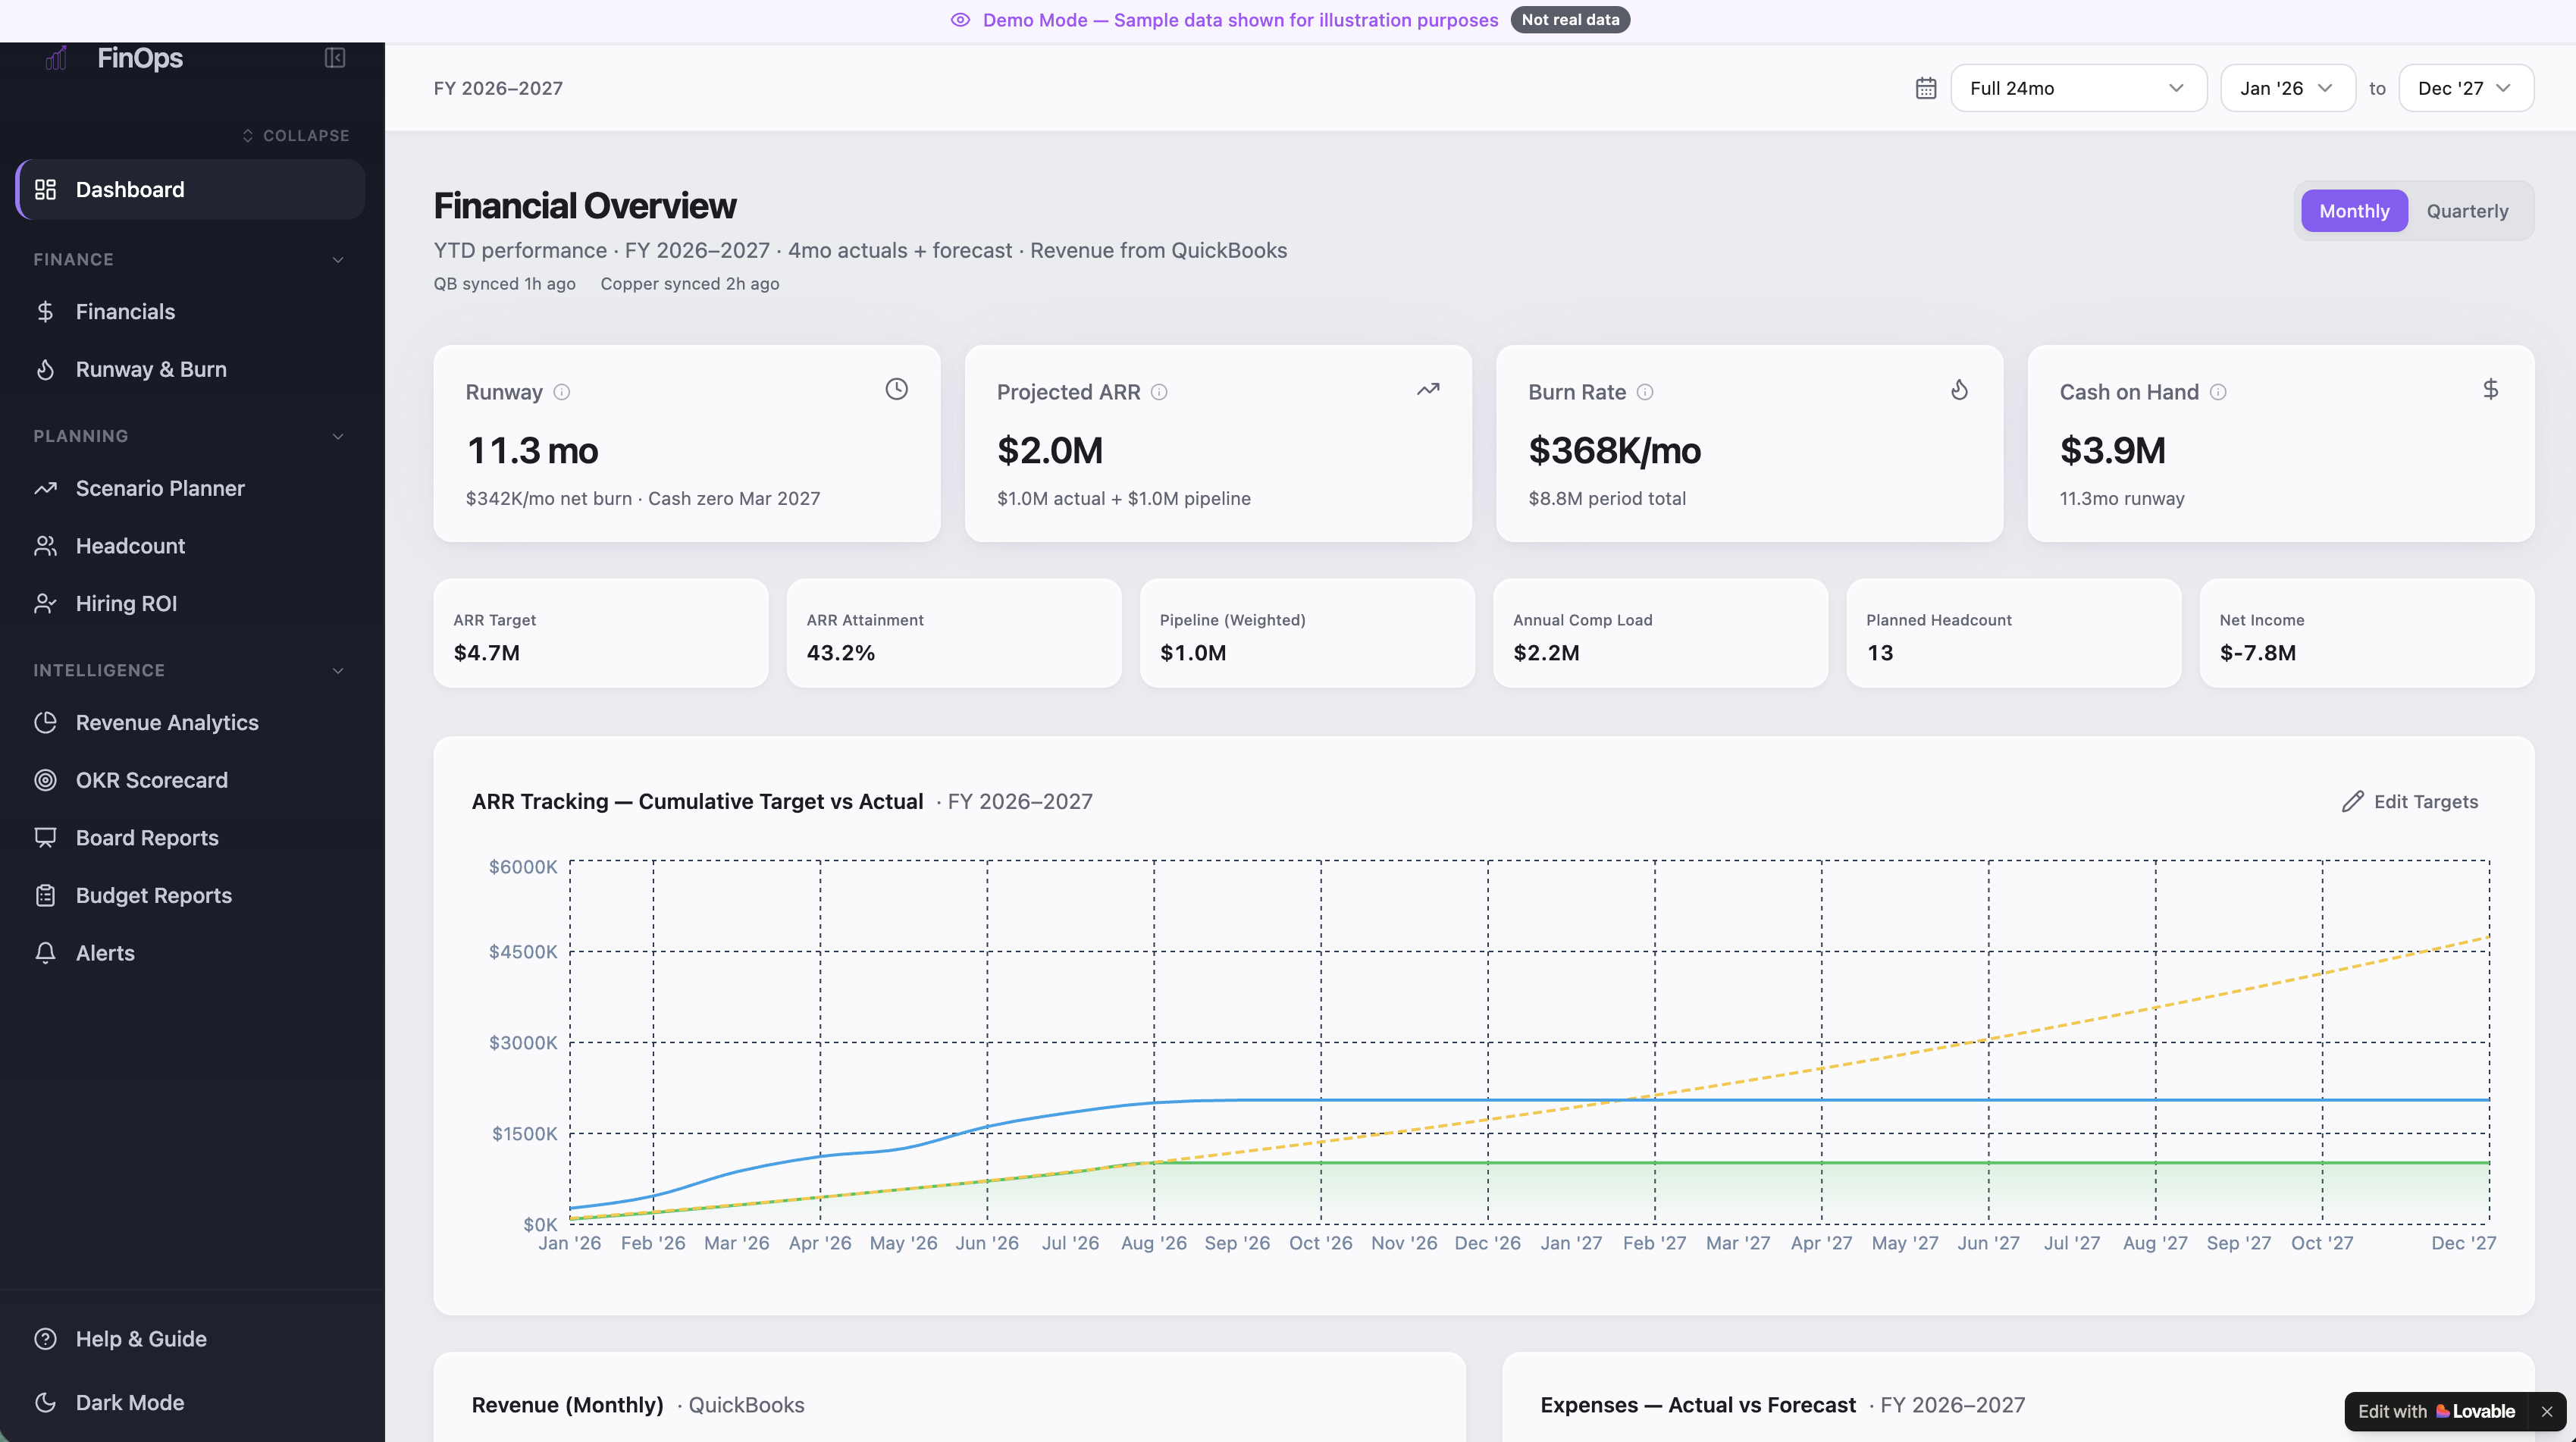
Ops Hub Financial Overview Dashboard

Built in days.
Running the business within 60.

When I joined Syntracts as their Chief of Staff, it was a time when the founding team was moving fast and needed to scale their visibility to match their ambition. After reviewing already established tools that felt too costly, I scoped and built the first working version of the hub in just a few days, integrating live data sources, and embedding it into how the company actually ran.

60
Days to full rollout — with the first working version running within a week of starting
5+
Integrated modules: financials, headcount, OKRs, pipeline, board reports
0→1
Built without a PM, without a blueprint, without prior tooling
Live
Real-time data via QuickBooks and Copper CRM integrations

What it actually looks like.

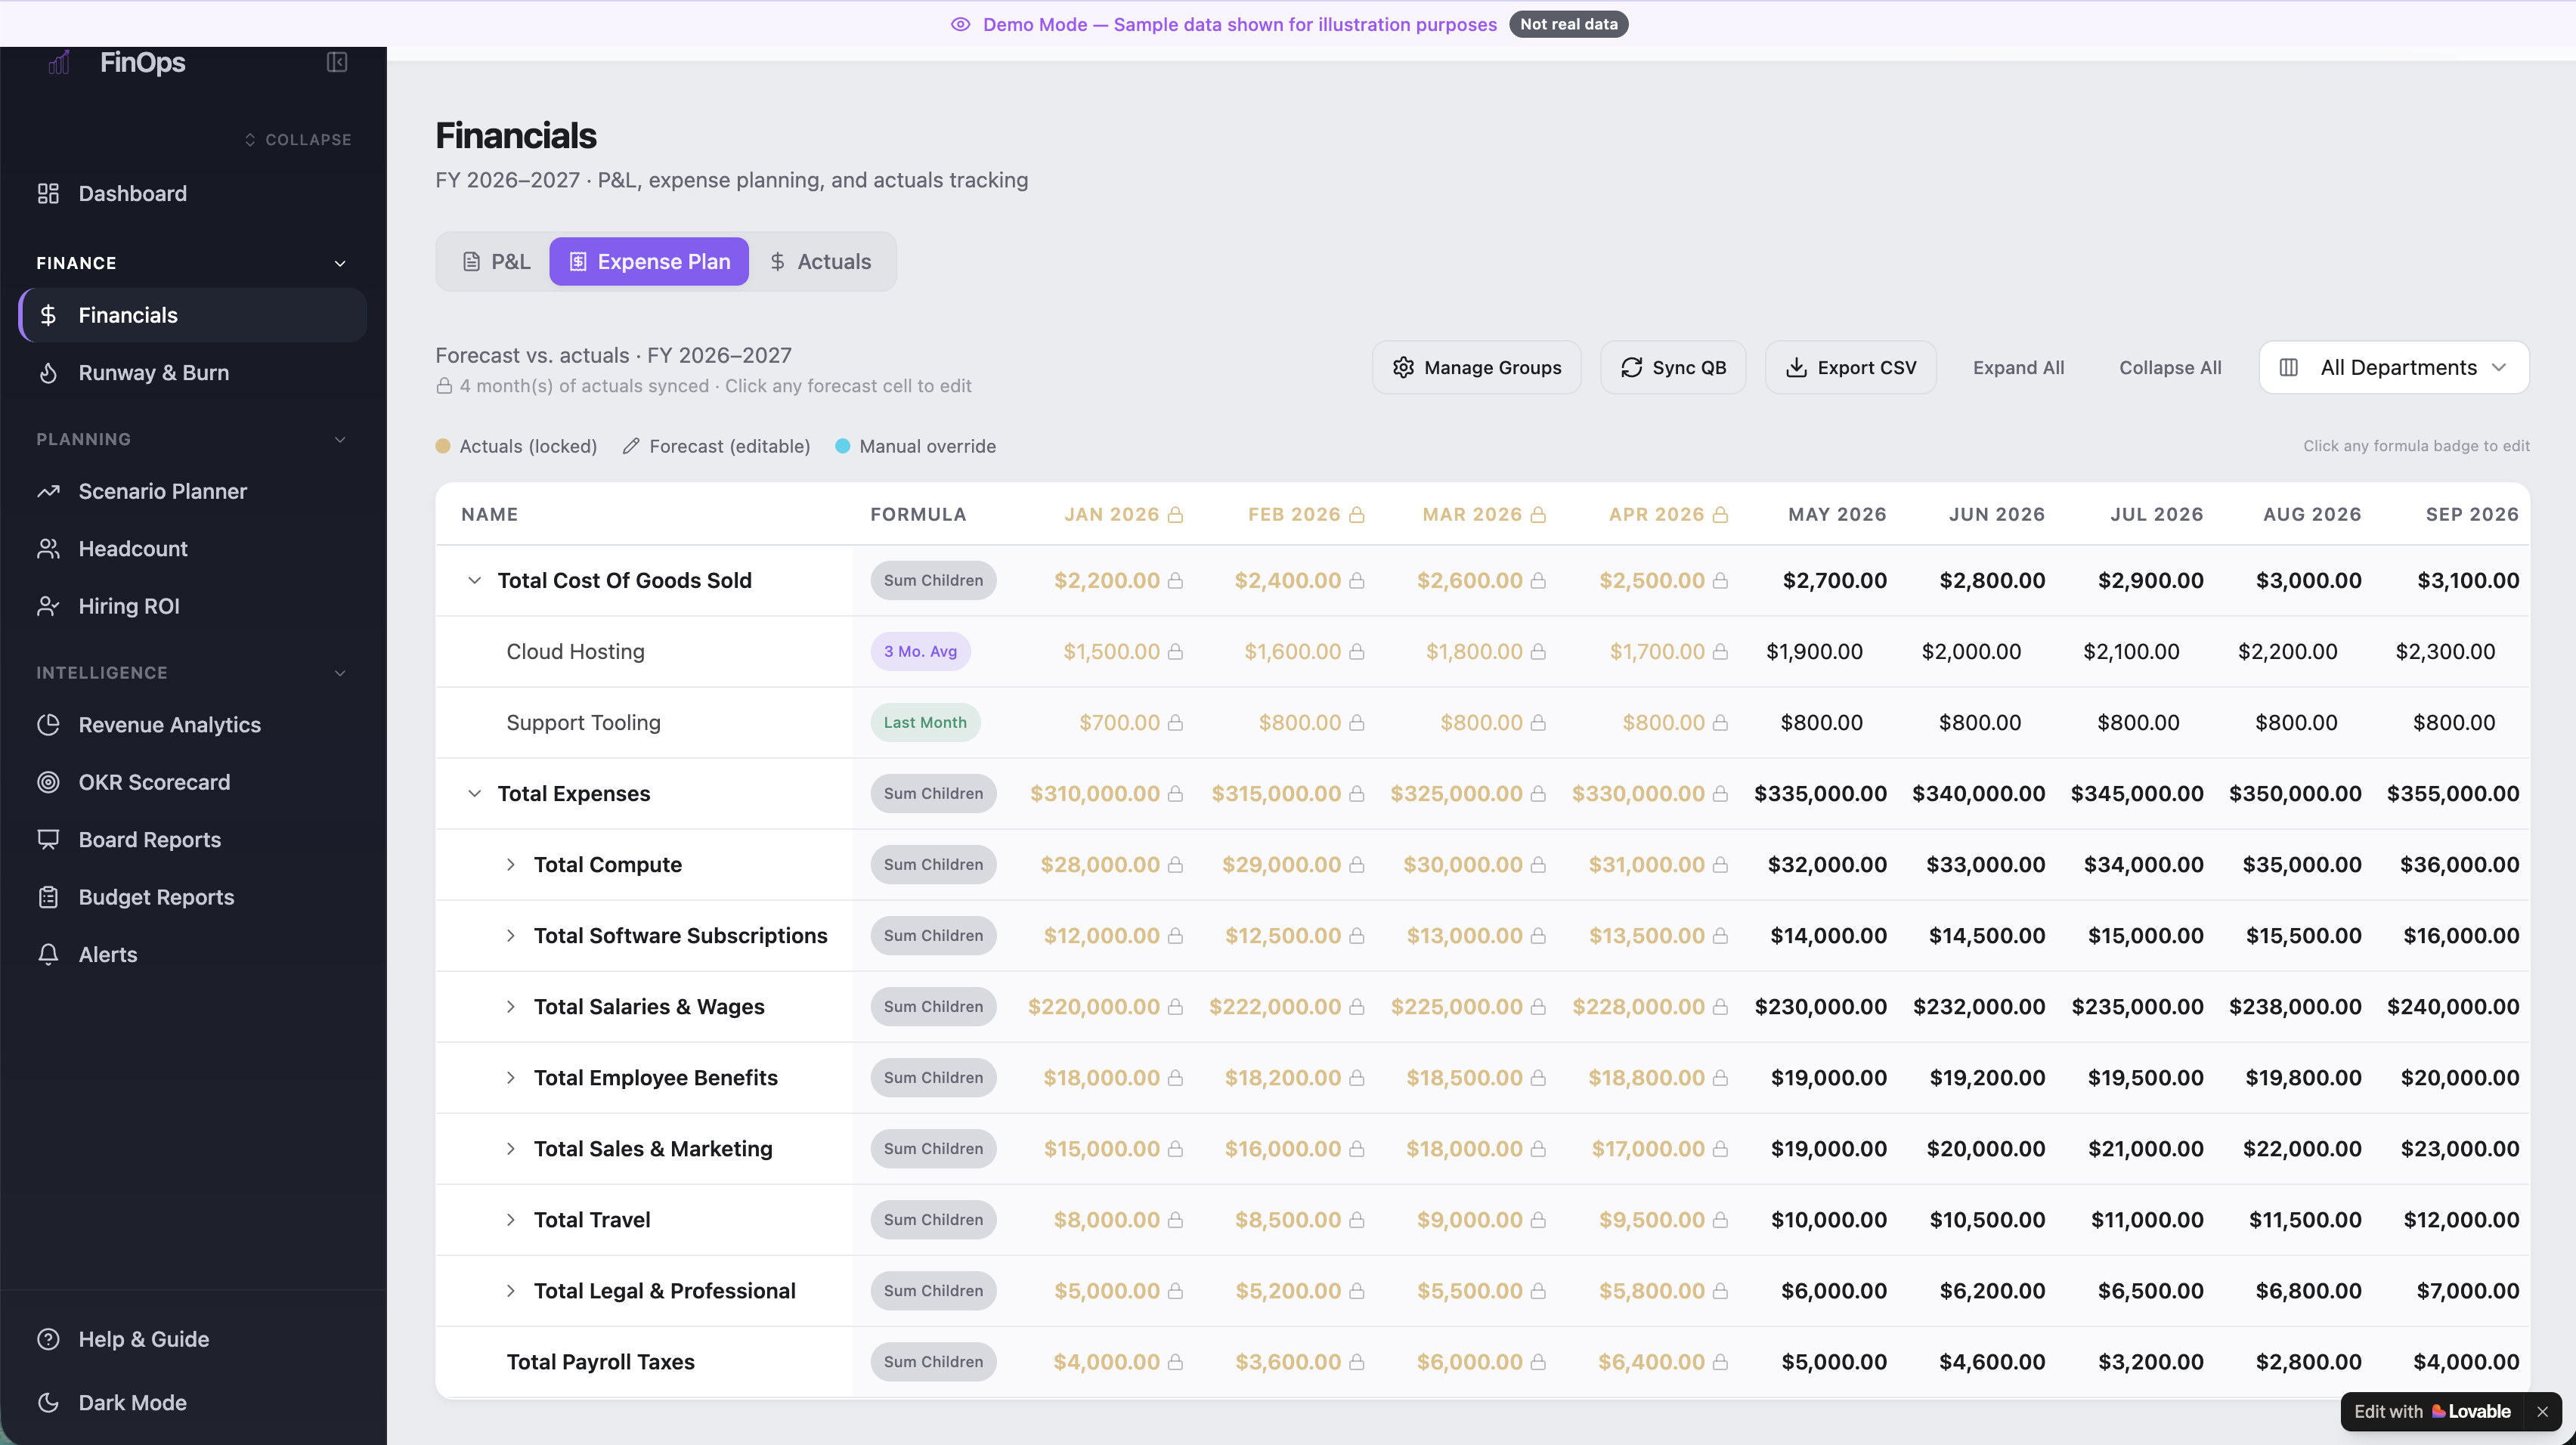
Financials — P&L and Expense Planning
Financials — P&L, Expense Plan, Actuals vs. Forecast
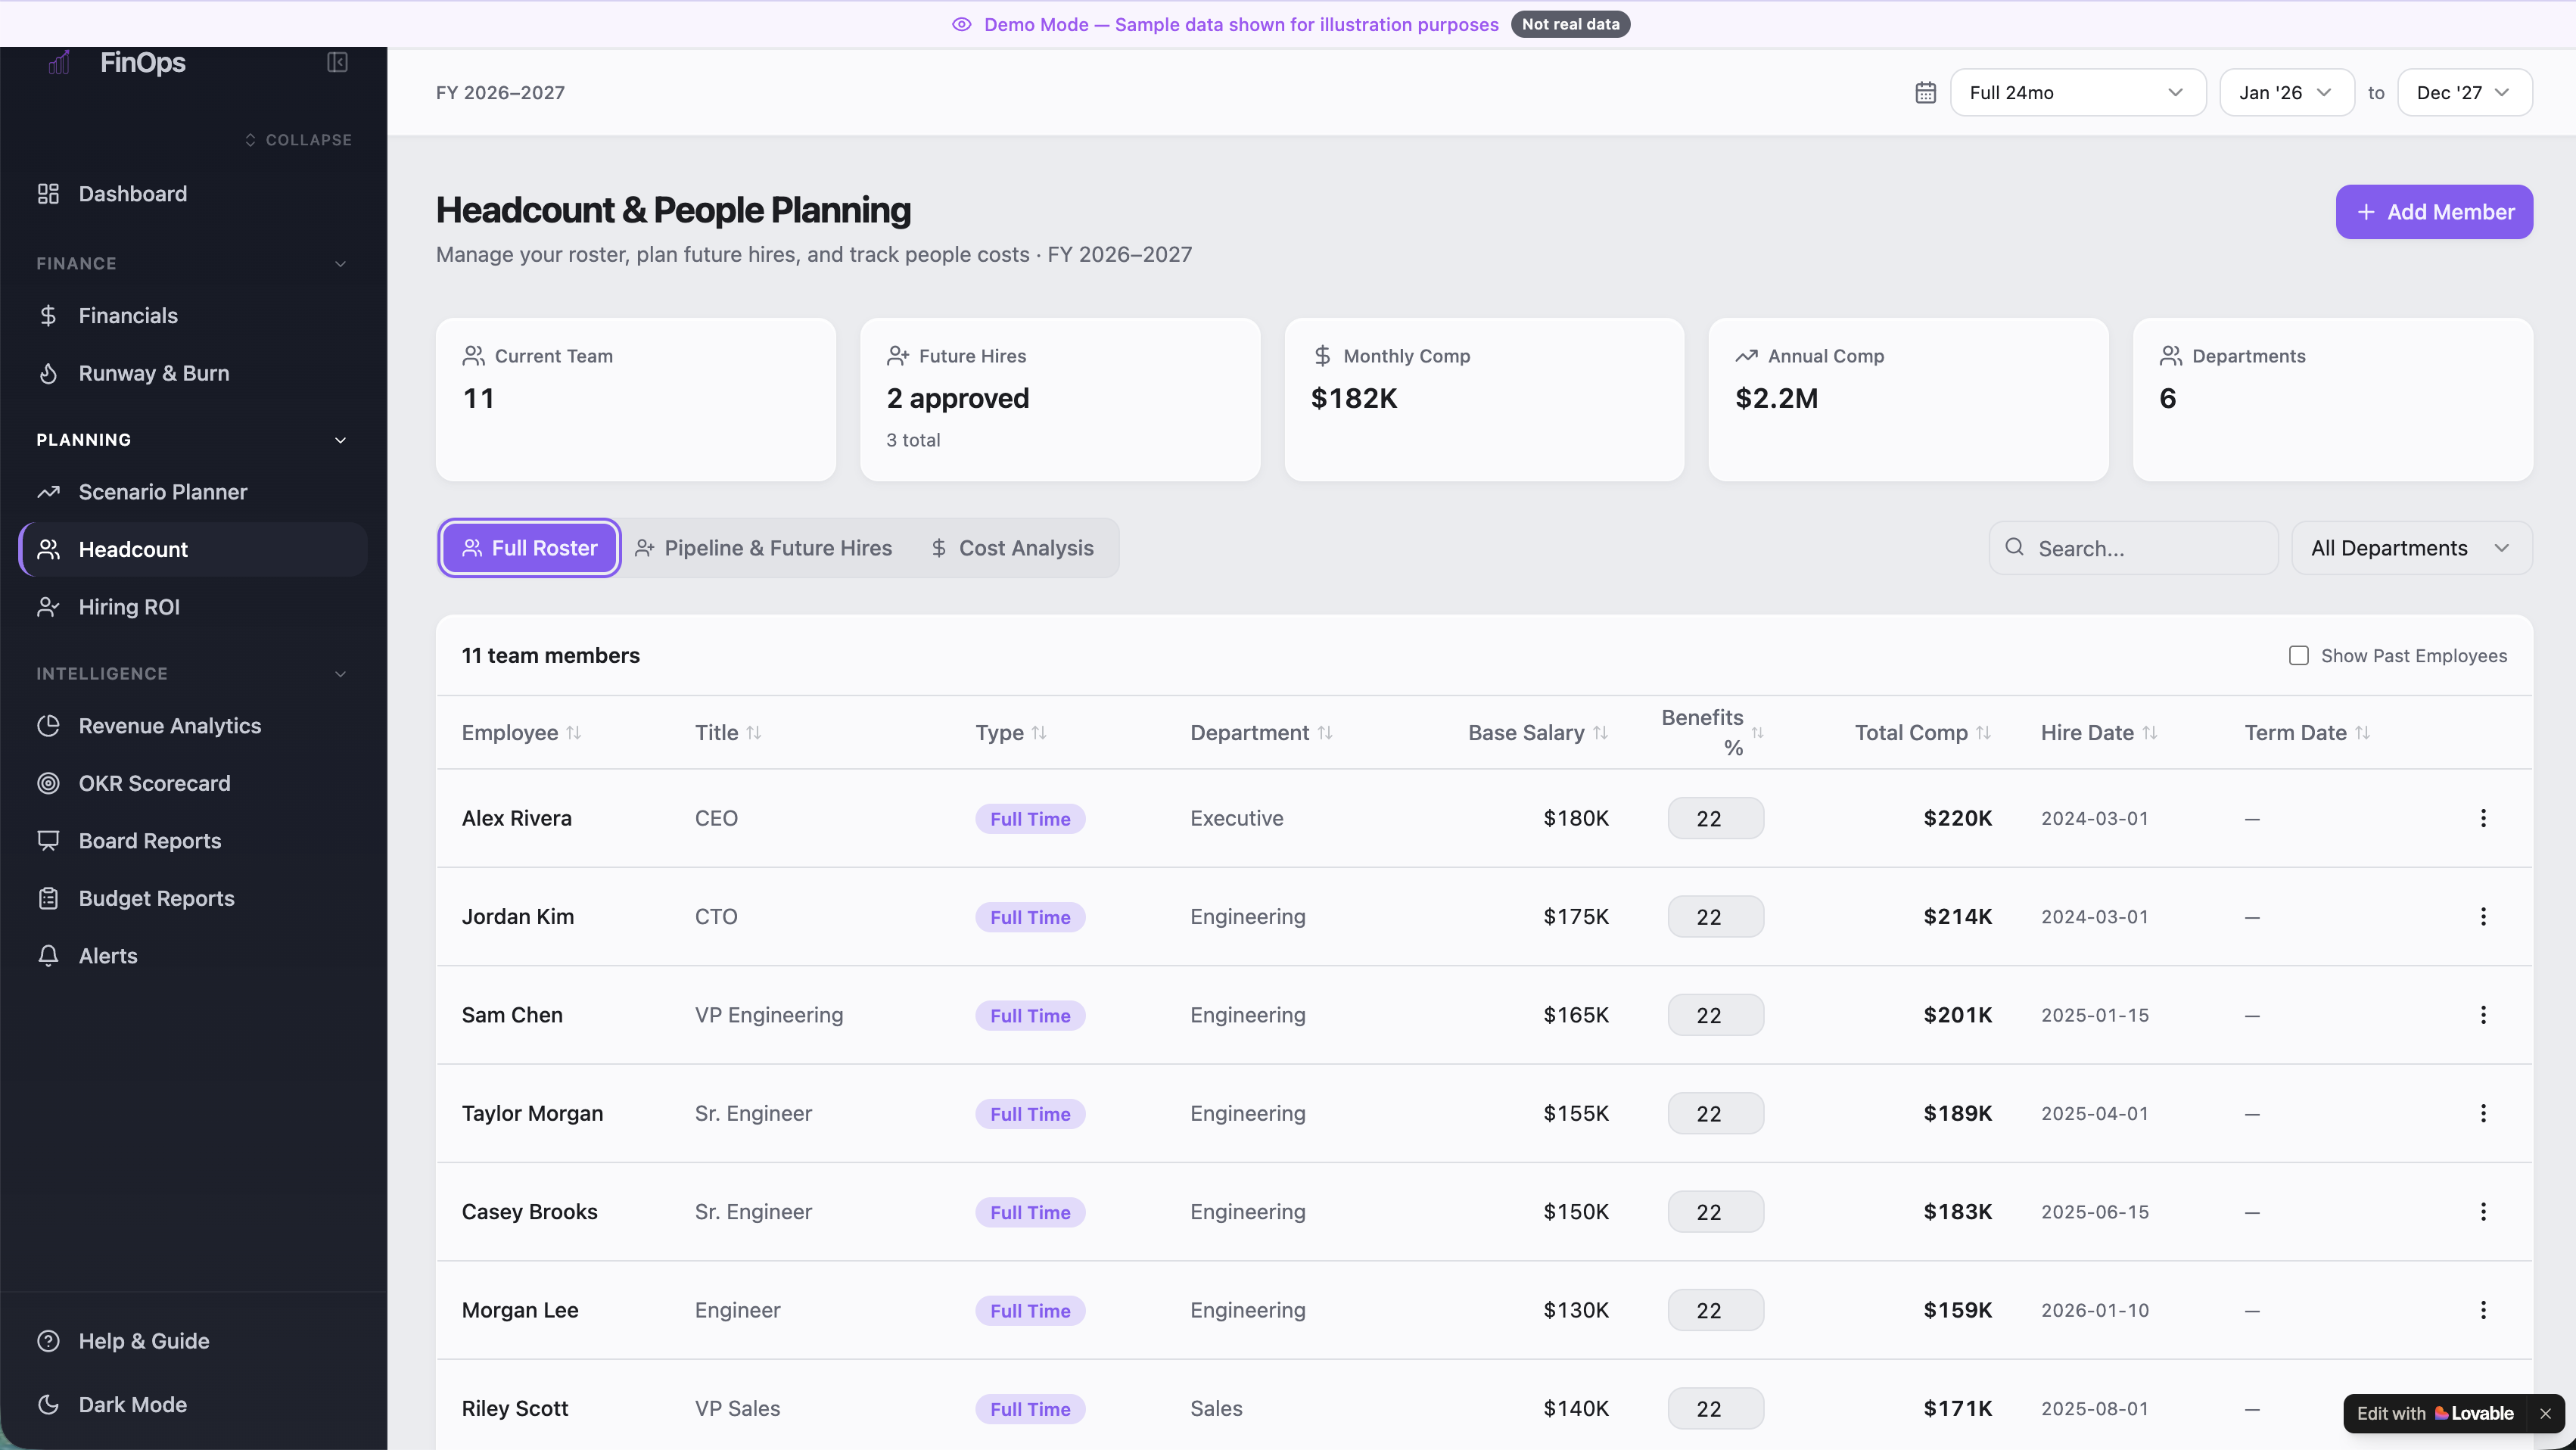
Headcount & People Planning
Headcount & People Planning — Roster, Future Hires, Cost Analysis

Everything in one place.

01
Financial Tracking
Full P&L with actuals vs. budget, forecasting via manual entries and averages, and custom categorization — synced live from QuickBooks.
02
Headcount & Scenario Planning
Real-time visibility into team roster, future hires, comp load, and how every headcount decision impacts the bottom line.
03
Revenue & Pipeline
Forecasted revenue (predicted and weighted) pulled from Copper CRM alongside a live prospective client list — no manual entry required.
04
OKR Scorecard
Company OKRs tracked in real time so leadership always knows where they stand against targets — no spreadsheet hunting required.
05
Weekly Slack Reports
Automated weekly summaries surfacing what needs attention and what's going well — so leadership always knows where to look without digging.
06
AI Chatbot Interface
A built-in chatbot lets anyone on the team ask questions directly against all of the data — no SQL, no dashboards, just answers.

No PM. No blueprint.
Just a problem to solve.

I scoped, built, and deployed the entire hub myself — using Lovable for the app layer and native integrations for live data.

Step 01
Diagnosed the Gap
In my first week I mapped what the founding team needed to run the business at scale — and where manual processes were creating drag. Financials lived in spreadsheets, reporting was ad hoc, and there was no centralized view of headcount or OKRs. I scoped the hub quickly and moved straight into building.
Discovery Stakeholder Needs Scoping
Step 02
Built the App in Lovable
Used Lovable to build the full dashboard interface — financial overview, P&L, runway and burn, headcount planner, scenario modeler, OKR scorecard, board reports, and budget reporting. Built fast — a working version was running within days. Then iterated module by module rather than waiting for a perfect v1.
Lovable Product Thinking Rapid Iteration
Step 03
Integrated Live Data Sources
Connected QuickBooks for actual financial data and Copper CRM for pipeline visibility. Set up automated syncs to keep data current and push weekly Slack summaries to the leadership team — eliminating the manual reporting loop entirely.
QuickBooks Copper CRM Slack Automation
Step 04
Deployed & Used in Practice
By day 60 the hub was the operating layer for the founding team — used in board prep, investor conversations, and weekly leadership reviews. The CEO walked investors through the financial dashboard directly. What started as a few-day build became the infrastructure the whole company ran on.
Board Prep Investor Relations Leadership Cadence

A single source of truth — built in days, running within 60

The Ops Hub gave a founding team the visibility and operating rhythm they needed to scale with confidence.

Built in days, not months — a working dashboard running within the first week, fully integrated and rolled out by day 60.
Eliminated manual reporting — automated weekly summaries replaced ad hoc finance requests entirely.
Investor-ready at any moment — CEO used the dashboard directly in investor conversations.
Headcount decisions grounded in data — scenario planning tied directly to P&L impact.
OKR accountability built in — leadership always knew where the company stood against targets.

Want to see it live?

Explore the demo or head back to the full portfolio.

← Portfolio View Live Demo →